Once your model is deployed, it can be managed from the Deployment Details dashboard. This page provides full visibility into the deployment’s status, configuration, performance, and operational activity.Documentation Index
Fetch the complete documentation index at: https://docs.tensormesh.ai/llms.txt
Use this file to discover all available pages before exploring further.
Accessing Deployment Details
Navigate to Operations → Dashboard → Select a Deployment to view the deployment management interface. Each deployment includes four main tabs: Overview, Configuration, Metrics, and Logs & Events.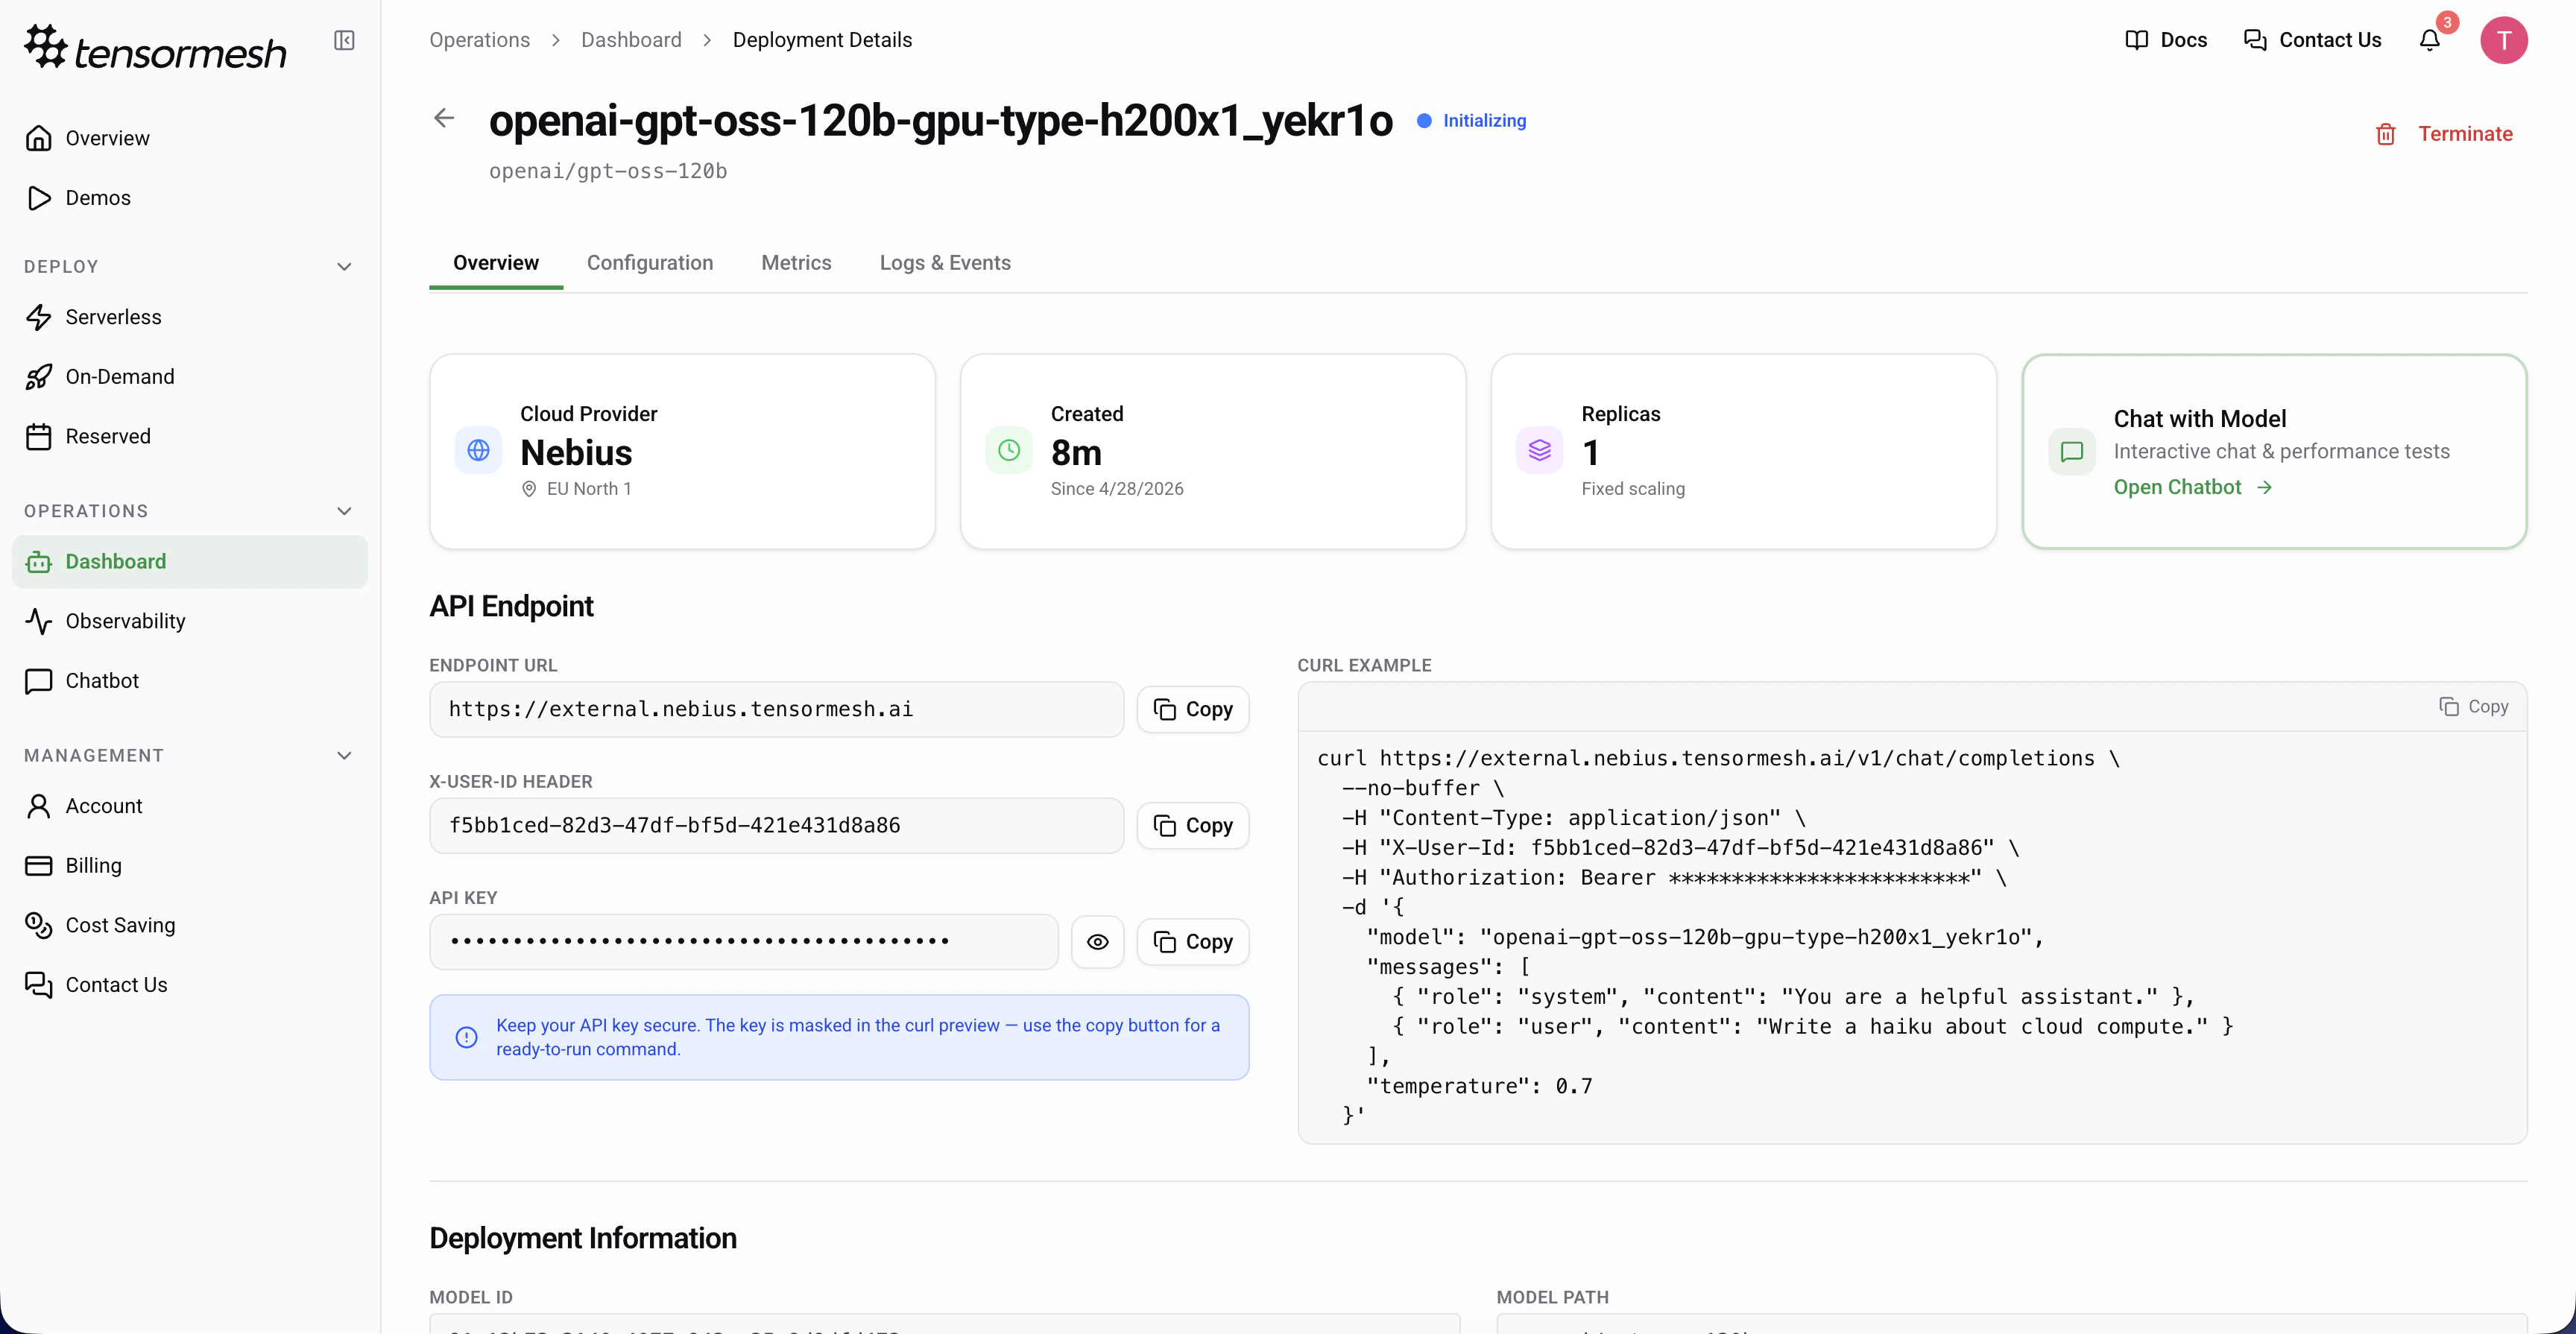
Overview Tab
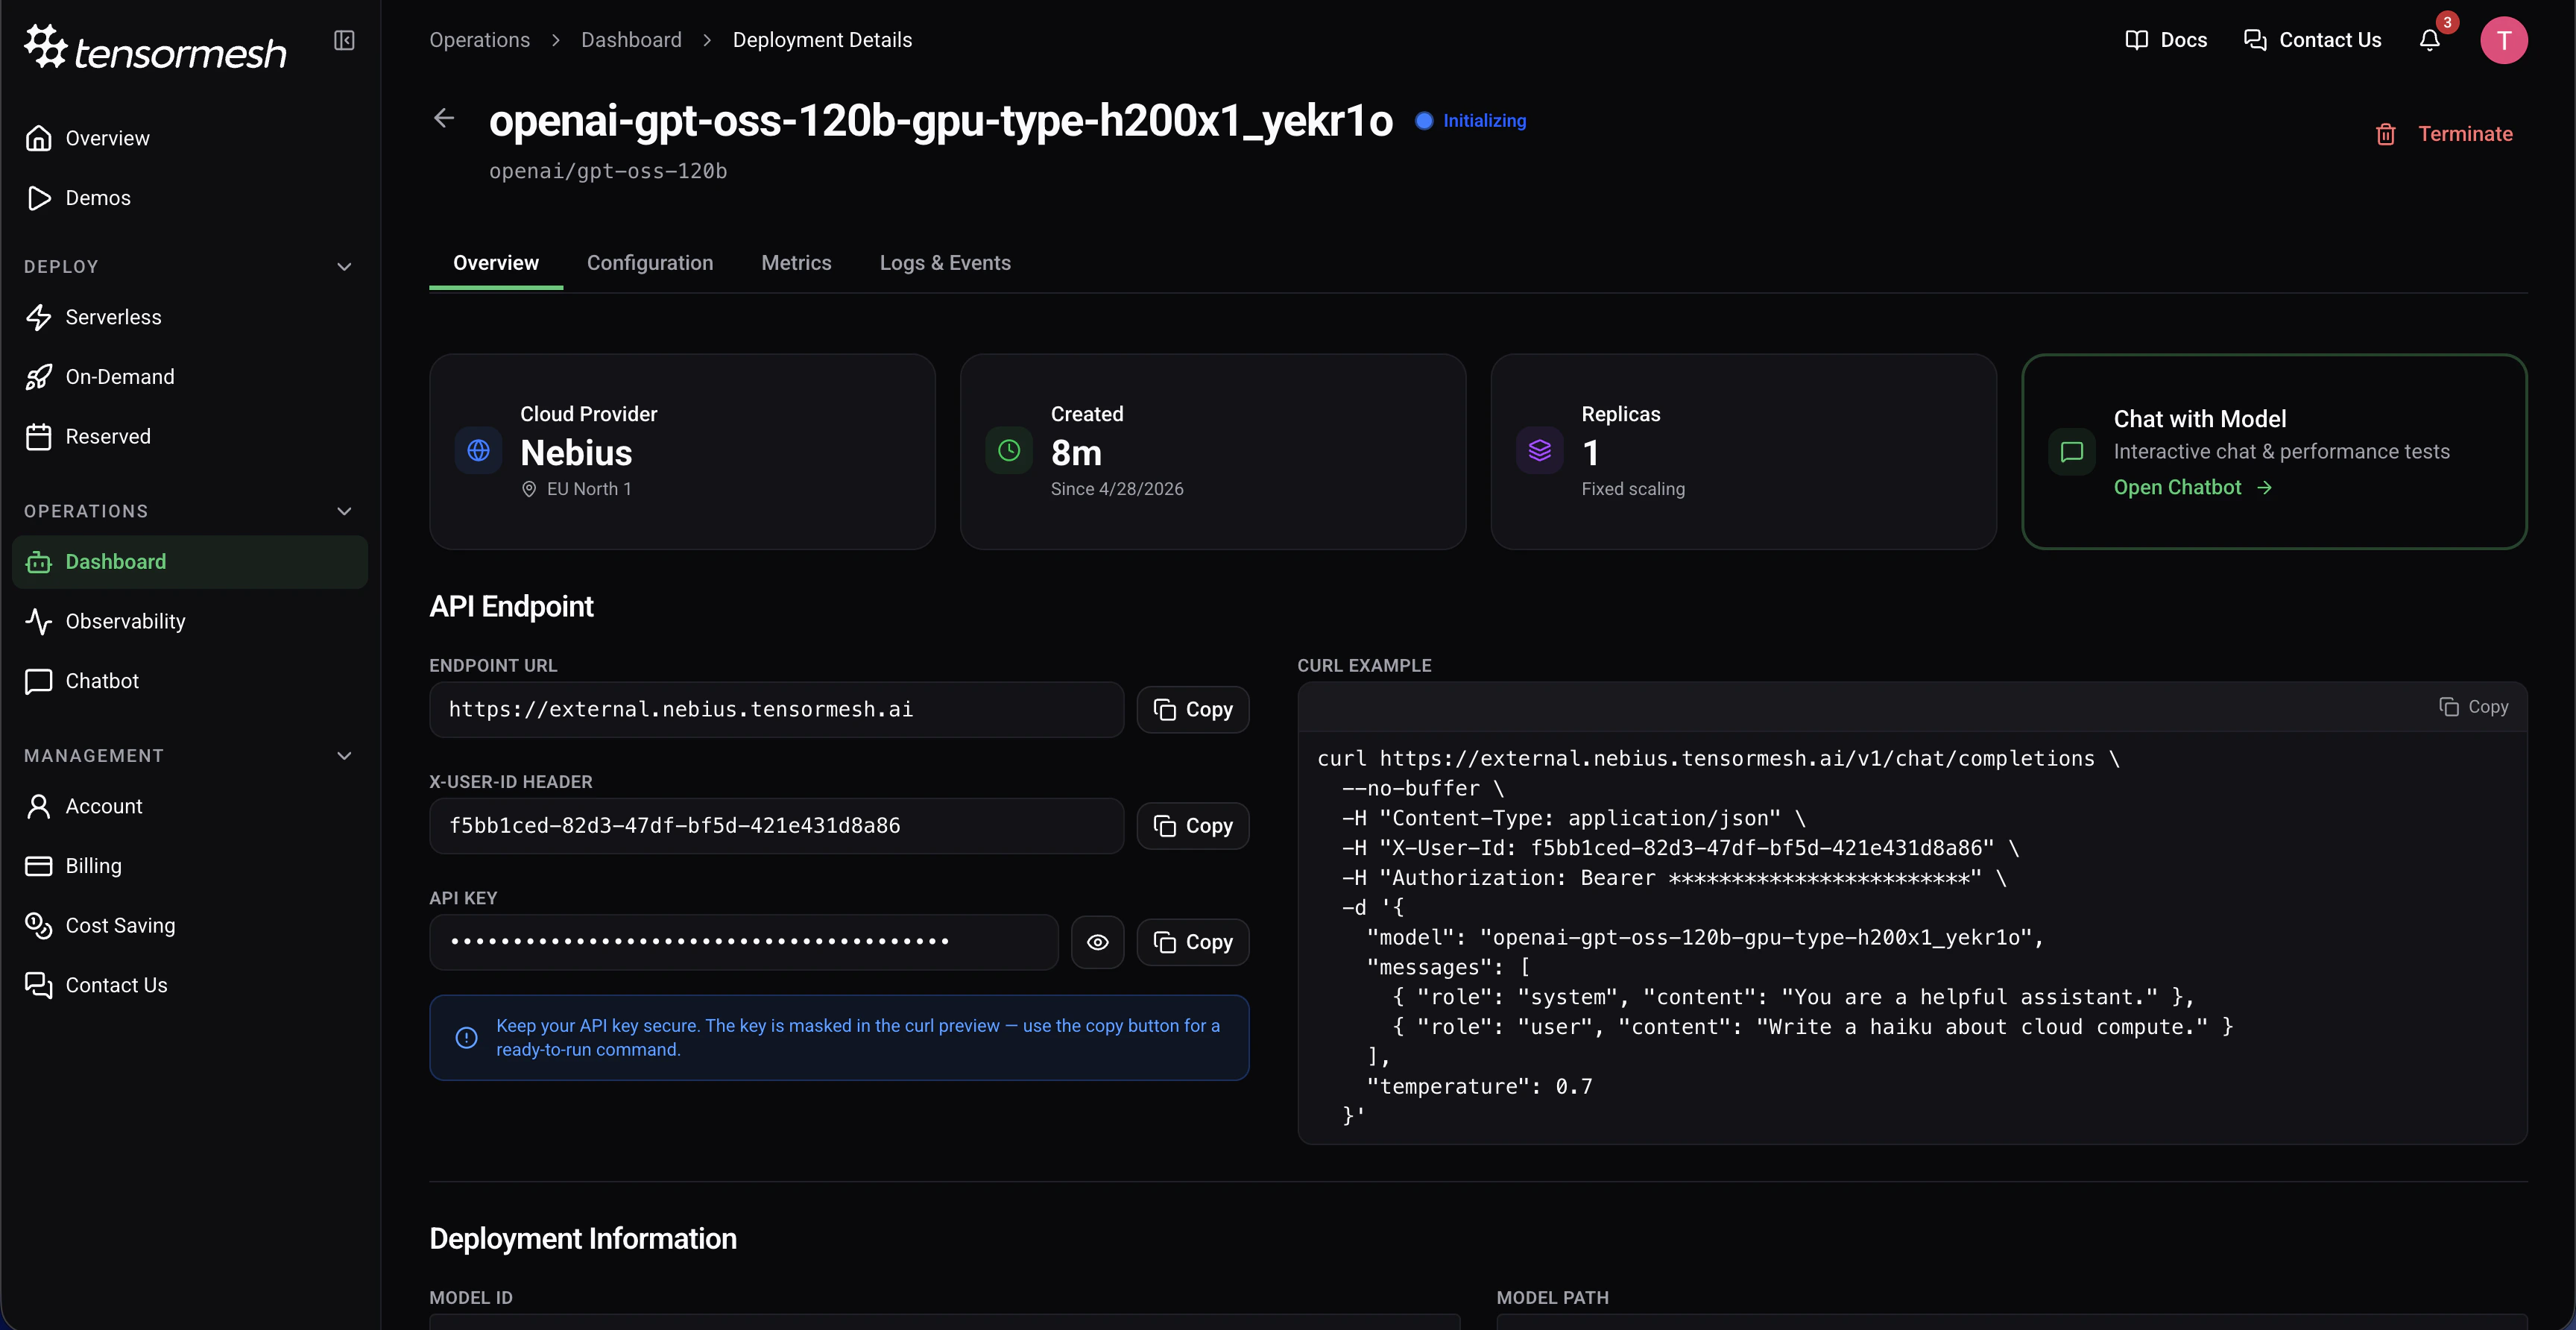
The Overview tab serves as the primary control and status panel for your deployment, displaying high-level, real-time information.Key Information
Status
The current lifecycle state of the deployment (e.g., Active, Initializing, Stopped, Error)
Cloud Provider
The cloud provider and region where the deployment is running (e.g., Nebius – EU North 1)
Run Time
The time since the deployment was created
Replicas
Displays current replica count
API Endpoint
The Overview tab provides direct access to your deployment’s API credentials: Endpoint URL — The base URL for making API requests to your deployed modelX-User-ID Header — Authentication header for user identification
API Key — Secure authentication token (keep this confidential)
cURL Example —A ready-to-use cURL command is provided for quick testing
Deployment Information
Additional deployment information includes: Model — The specific model being deployed (e.g.,openai/gpt-oss-20b)Created — Timestamp indicating when the deployment was initially created
Last Updated — Most recent modification timestamp
Configuration Tab
The Configuration tab displays the static setup parameters of your deployment.Configuration Details
This includes:- Model source and path
- Cloud provider and region selection
- GPU type and count
- Number of replicas
- Memory and compute allocations
- Network and storage settings
Metrics Tab
The Metrics tab provides real-time and historical performance insights for your LLM deployment.Available Metrics
The dashboard displays eight key performance metrics: Cache Hit Rate — Percentage of requests served from cacheTime to First Token (TTFT) — Latency from request to first token
Inter-Token Latency (ITL) — Time between consecutive tokens
Input Throughput — Request processing rate (QPS)
Output Throughput — Token generation rate
GPU Compute Utilization — GPU resource usage percentage
KV Cache Usage Ratio — Cache capacity utilization
Running Requests — Number of requests currently being processed
Time Range Selection
View metrics across different time windows: Last Hour — Real-time monitoringLast Day — Daily trends
Last Week — Long-term patterns
For detailed explanations of each metric, optimization strategies, and troubleshooting guidance, see the Monitoring Performance guide.
Logs & Events Tab
The Logs & Events tab displays a chronological activity log of system-generated deployment events.Event Types
Common events include: Initialization — Deployment startup progress and container launchesStatus Changes — Transitions between deployment states (Starting, Running, Stopped)
Errors — Failure messages and error codes for troubleshooting
Scaling Events — Replica additions or removals
Configuration Updates — Changes to deployment settings
Health Checks — Regular system health verification results
Using Logs for Troubleshooting
Logs help you:- Diagnose deployment failures and error conditions
- Track deployment lifecycle and state transitions
- Identify performance degradation causes
- Audit deployment activity and changes
- Debug integration and API connection issues