Documentation Index
Fetch the complete documentation index at: https://docs.tensormesh.ai/llms.txt
Use this file to discover all available pages before exploring further.
Overview
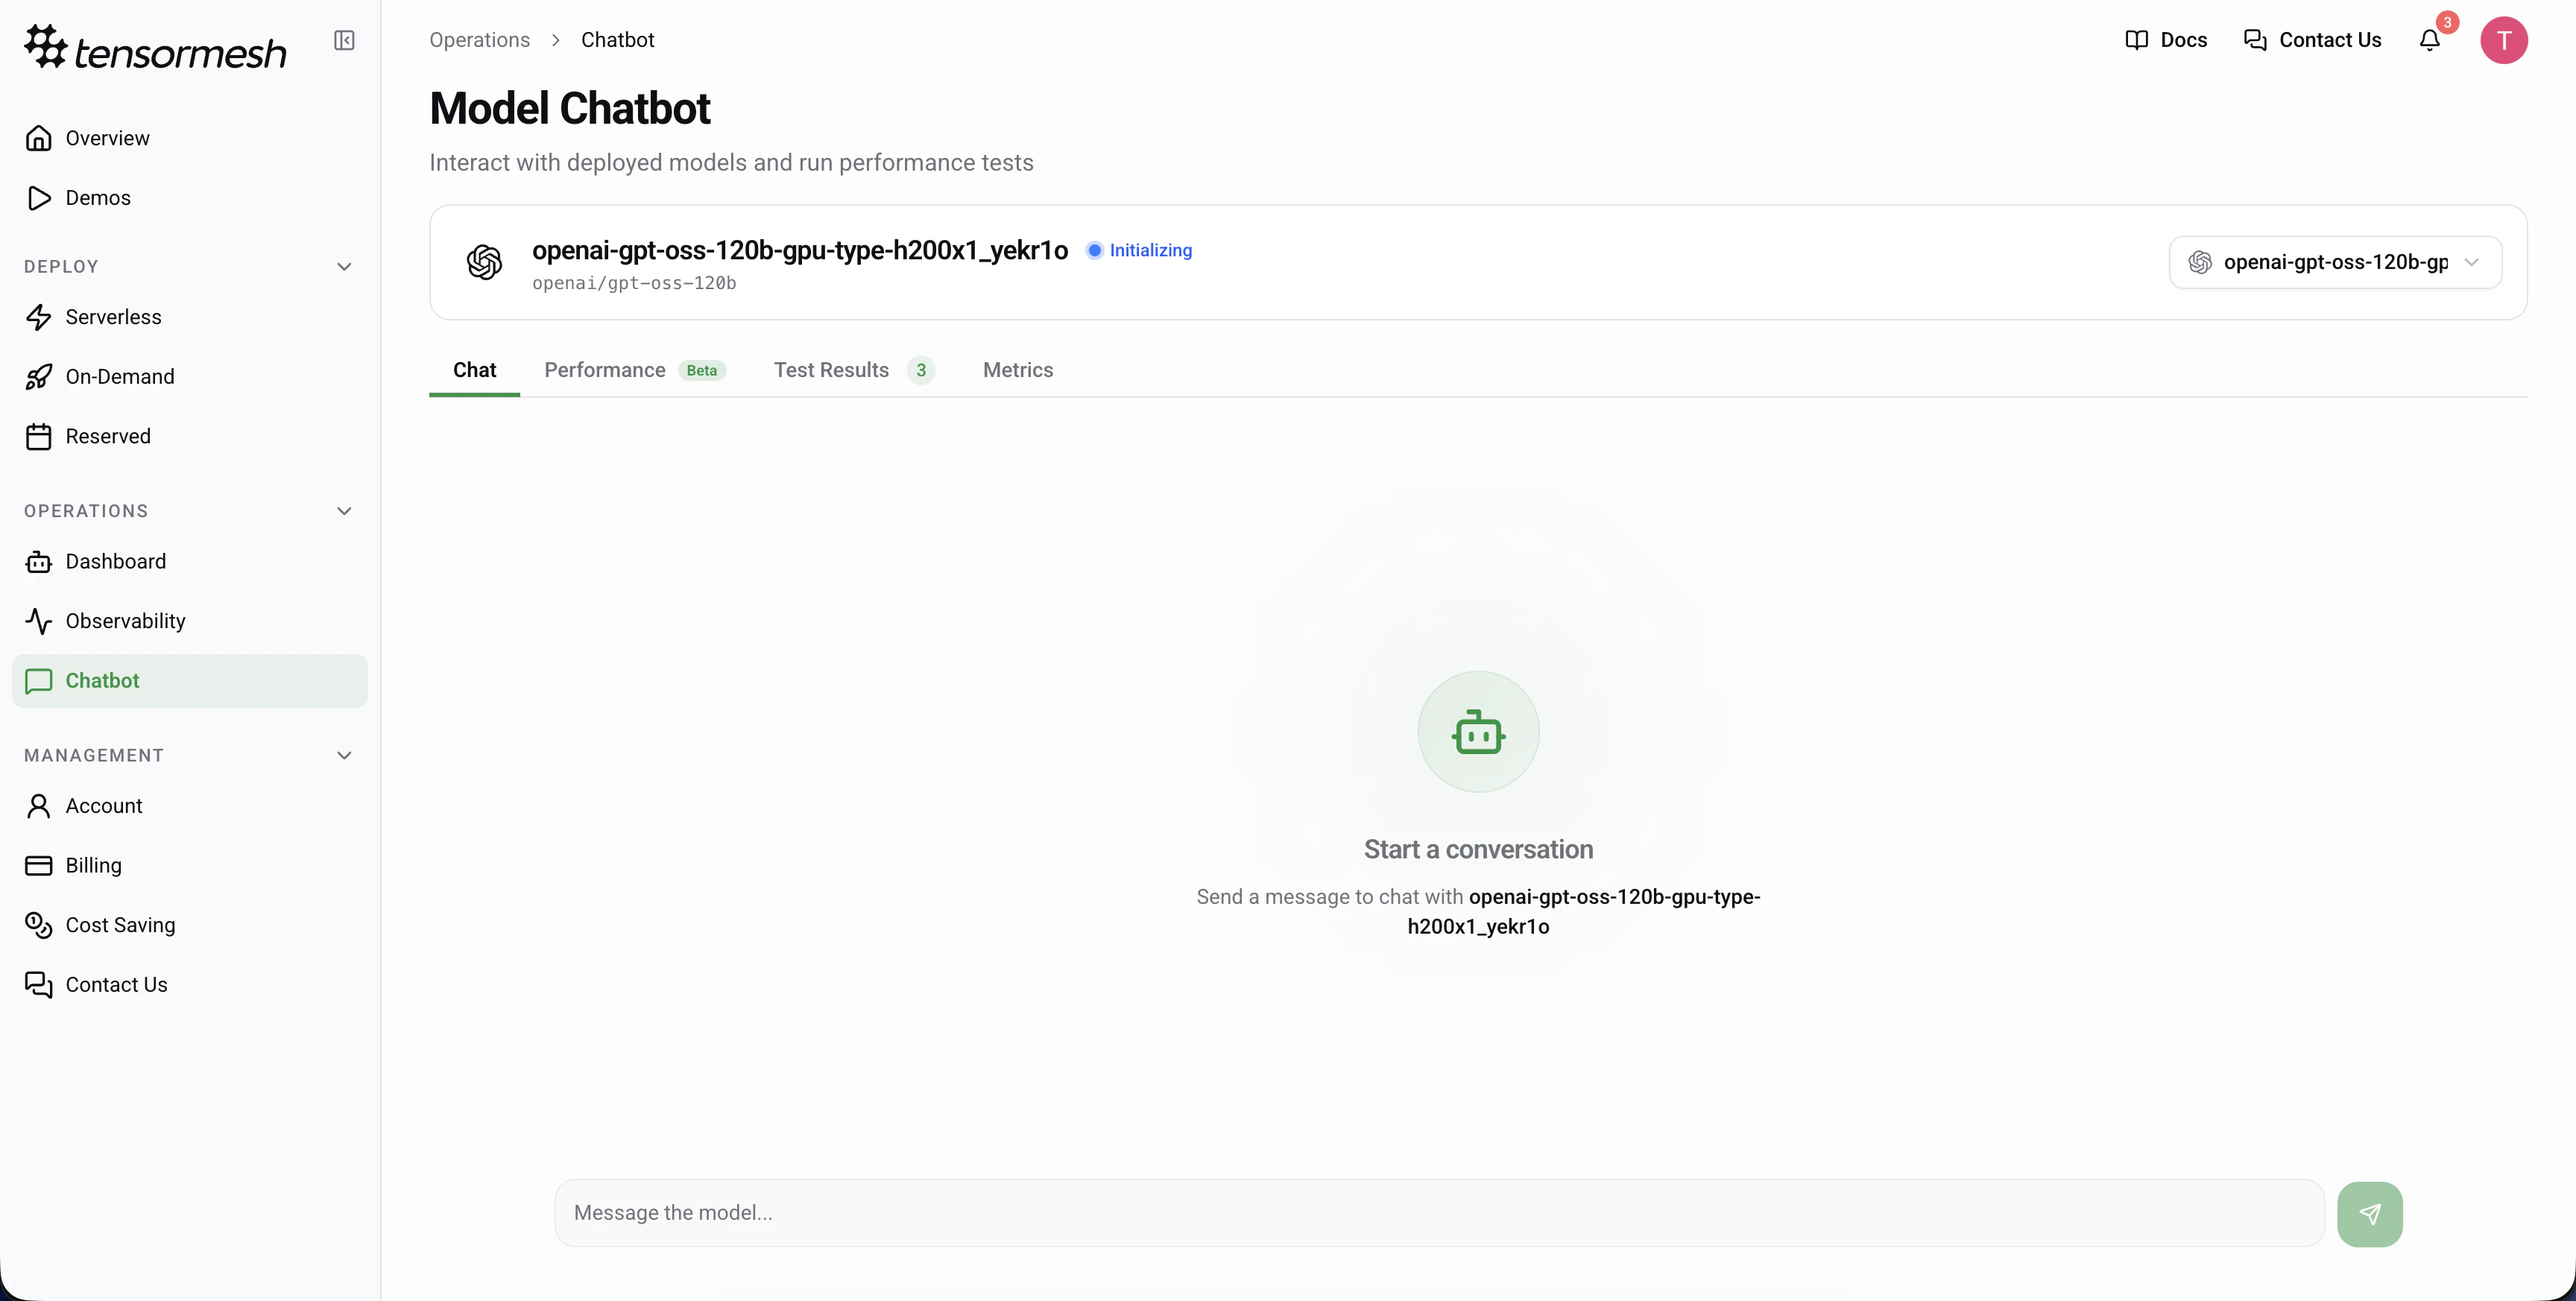
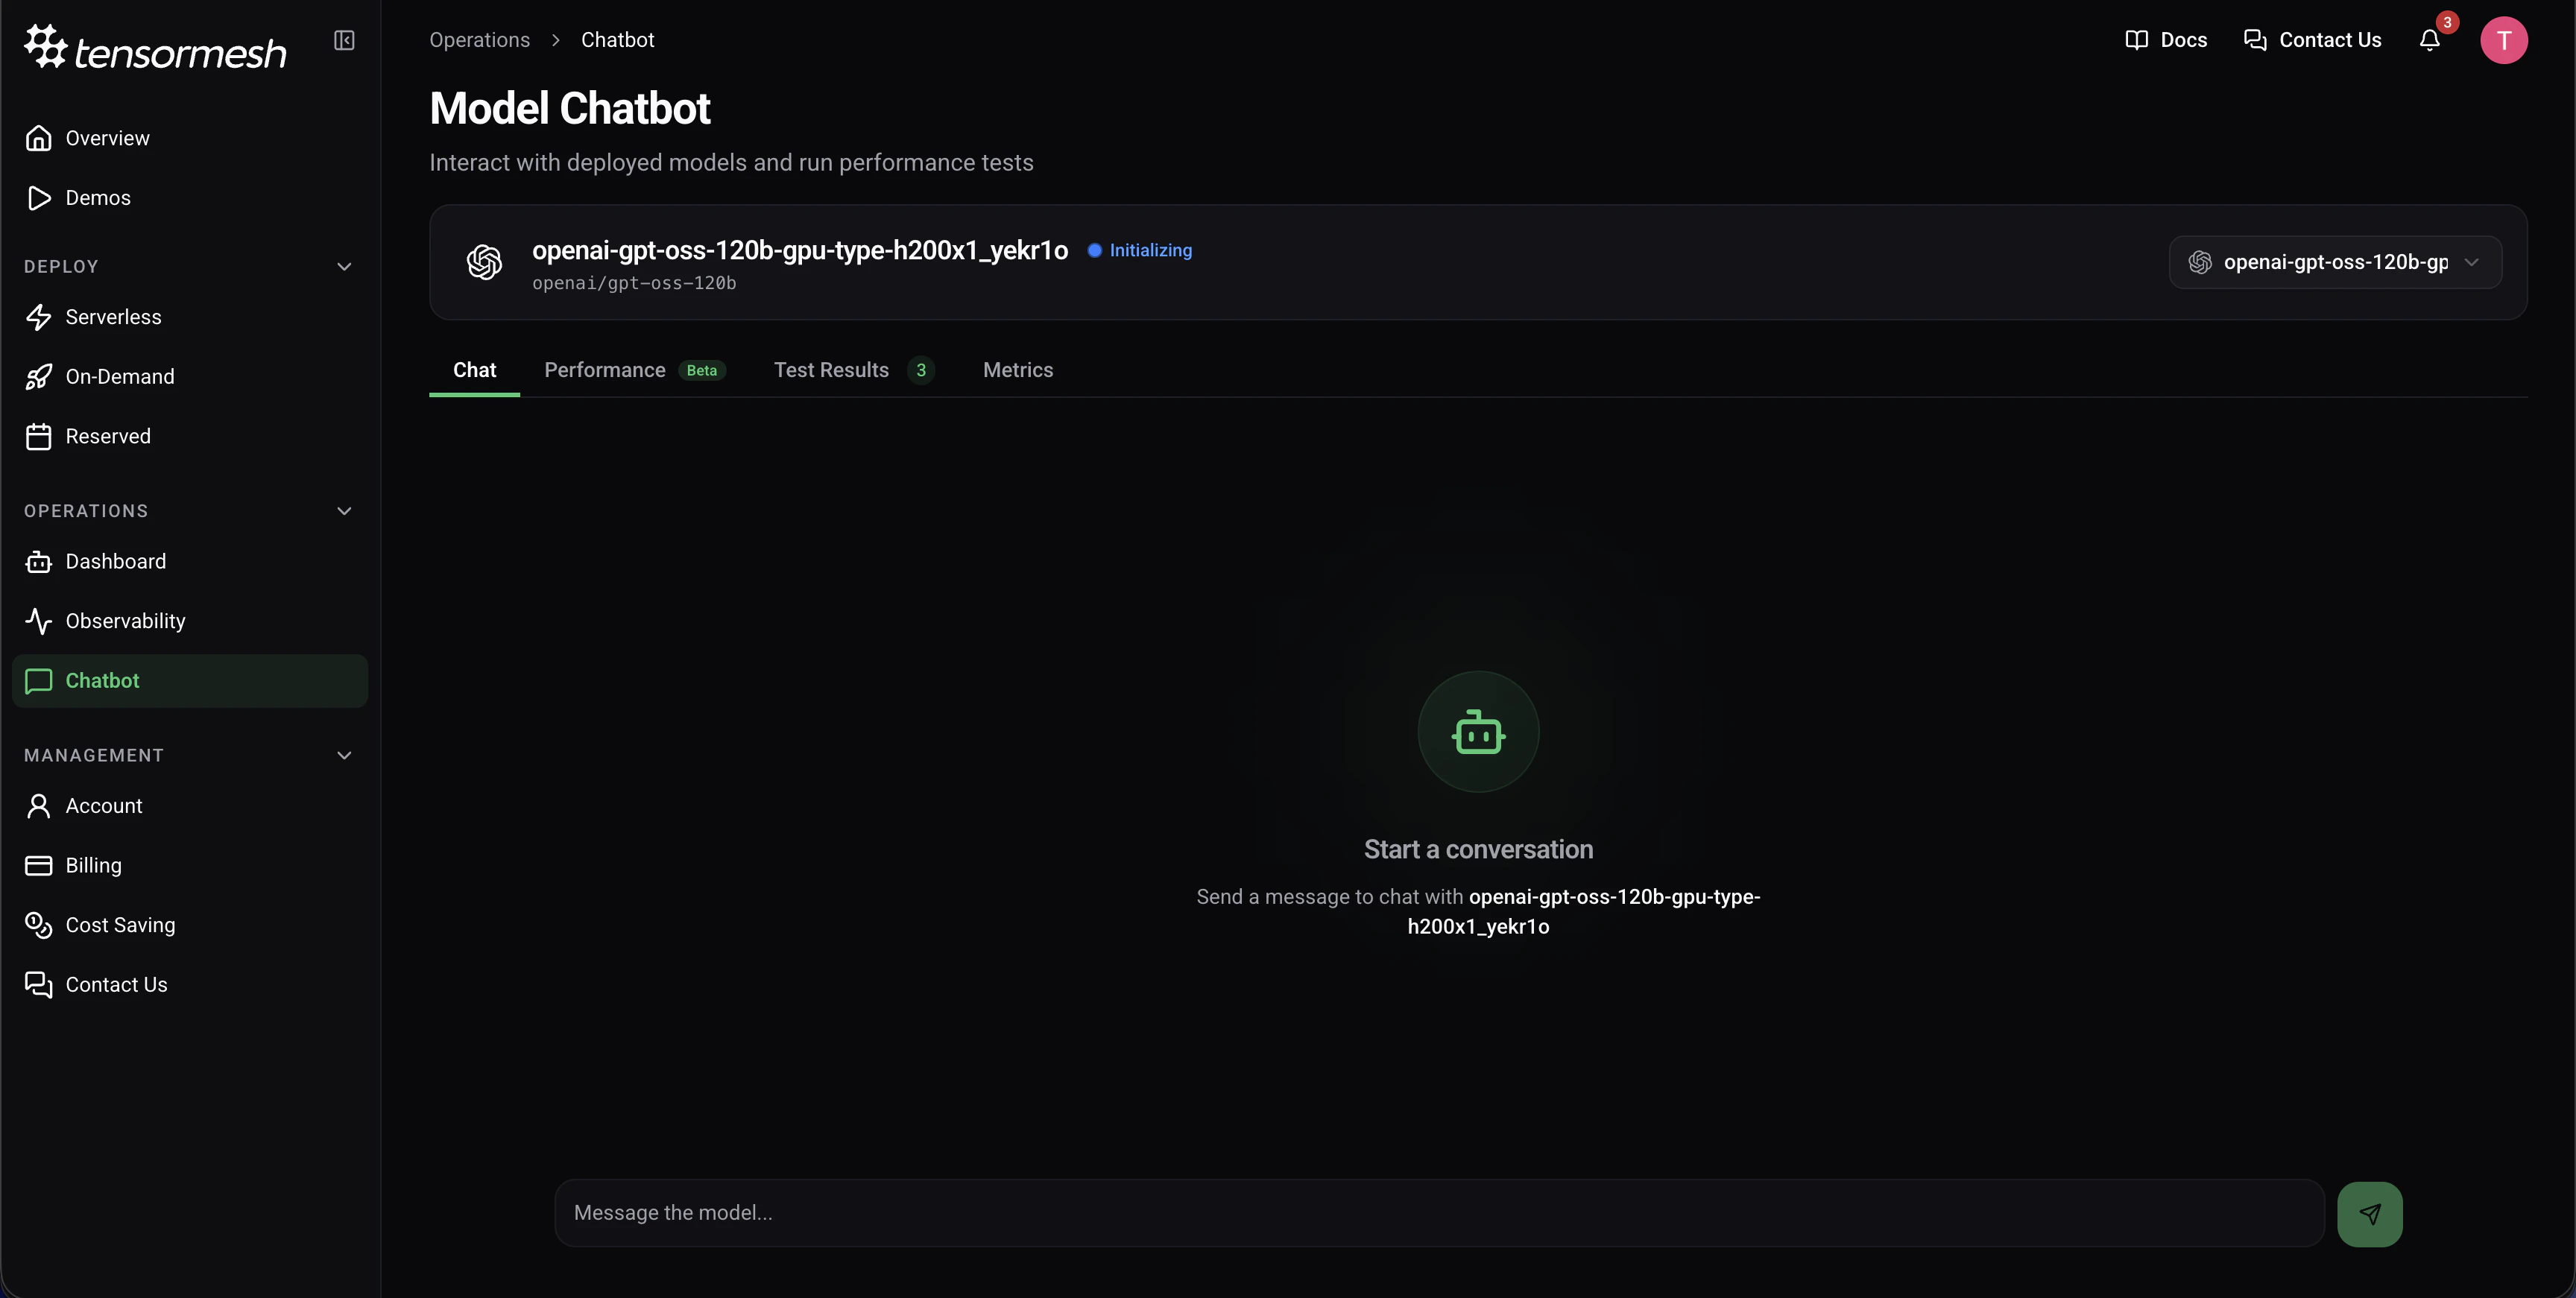
The Model Chatbot interface allows you to interact with your deployed models in real-time and run comprehensive performance tests.Getting Started
- Navigate to Operations → Chatbot from the sidebar
- Select your active deployment from the dropdown menu
- Start chatting with your model or configure performance tests
Interface Tabs
The Model Chatbot interface includes four main tabs:- Chat - Interactive conversation with your deployed model
- Performance - Load testing and performance metrics (Beta)
- Test Results - View historical test results (Beta)
- Metrics - Detailed performance analytics
Chat Interface
- Ensure your deployment status shows as Active (green indicator)
- Type your message in the input field at the bottom
- Click the send button or press Enter
- View the model’s response in the chat area
Performance Testing
Beta Feature: Performance testing is currently in beta. Features and metrics may be subject to change based on user feedback and ongoing improvements.
Test Configuration Parameters
Test Name (Optional) — Provide a descriptive name or leave empty for auto-generated IDConcurrent Users — Range: 1–500 users, simulates parallel requests (default: 100)
Test Duration — Range: 10–150 seconds of continuous testing (default: 20)
Running a Performance Test
- Navigate to the Performance tab
- Configure your test parameters
- Click Start Performance Test (green button)
- Monitor live metrics in the right panel
Tests run continuously for the configured duration while maintaining the specified concurrency level. Total requests will vary based on your model’s response time.
Understanding Live Metrics
During test execution, the Live Metrics panel displays: TTFT (Time To First Token) — Latency until the first token is generatedITL (Inter-Token Latency) — Time between subsequent tokens
Cache Hit Rate — Percentage of requests served from cache
Throughput — Requests processed per second
Test Results
Beta Feature: Test Results tracking is currently in beta. The format and available metrics may evolve as we refine this feature.
- Compare performance across different test runs
- Track improvements or regressions
- Analyze trends over time